Hi! I’m encountering an issue with y-Redis concerning memory synchronization. I’ve heard that y-Redis only loads into memory for initial synchronization, so I’ve been testing using the basic server example provided.
For my tests, I’ve removed the authentication-related code but made no other modifications. I’ve successfully cloned the repository and configured REDIS and POSTGRES properly. The connection with the client is working correctly, and I’ve confirmed that collaborative editing functions as expected.
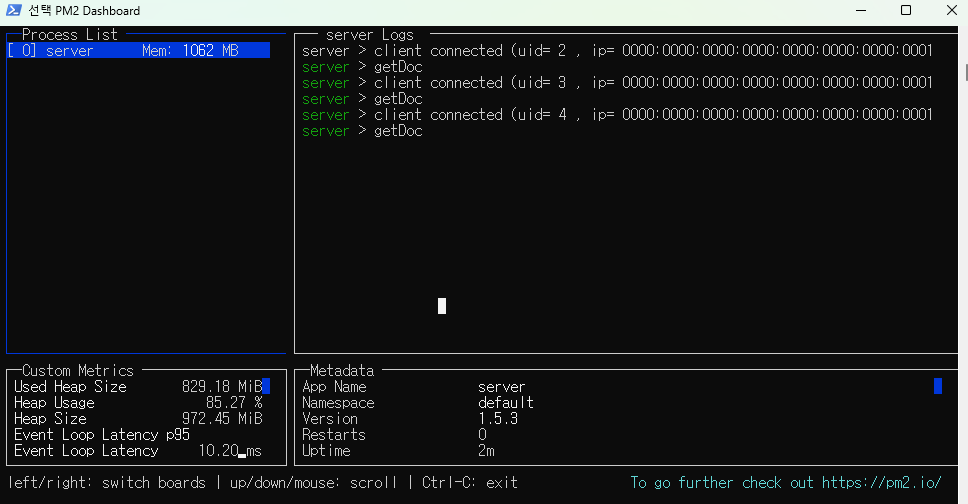
However, while monitoring memory usage with pm2, I’ve noticed something peculiar. Whenever someone accesses a document that is being edited, the server’s heap size increases by the size of the document. I’m looking for a way to prevent the heap size from increasing like this.
Furthermore, the heap size remains increased and does not decrease as expected.
Secondly, when the size of the document is large, it causes the worker to crash. I’m seeking assistance in identifying the cause of this issue and finding a solution.
getDoc
@y/redis/api/worker: Compacted stream {"stream":"y:room:1:index","taskId":"1711698836970-0","newLastId":1711698802365} +1958ms
@y/redis/api/worker: Accepted tasks {"tasks":[{"stream":"y:room:1:index","id":"1711698868934-0"}]} +30018ms
getDoc
@y/redis/api/worker: Compacted stream {"stream":"y:room:1:index","taskId":"1711698868934-0","newLastId":1711698827356} +2082ms
@y/redis/api/worker: Accepted tasks {"tasks":[{"stream":"y:room:1:index","id":"1711698901033-0"}]} +30010ms
getDoc

<--- Last few GCs --->

[9612:000002D584CE0C30]   474405 ms: Mark-Compact 3774.1 (4137.1) -> 3773.4 (4136.8) MB, 660.68 / 0.00 ms  (average mu = 0.948, current mu = 0.185) allocation failure; scavenge might not succeed
[9612:000002D584CE0C30]   476174 ms: Mark-Compact 3789.1 (4136.8) -> 3788.4 (4168.1) MB, 1765.93 / 0.00 ms  (average mu = 0.801, current mu = 0.002) allocation failure; scavenge might not succeed


<--- JS stacktrace --->

FATAL ERROR: Reached heap limit Allocation failed - JavaScript heap out of memory
 1: 00007FF60327B38F node::SetCppgcReference+13791
 2: 00007FF6031F4F56 DSA_meth_get_flags+76118
 3: 00007FF6031F6D91 DSA_meth_get_flags+83857
 4: 00007FF603CB4701 v8::Isolate::ReportExternalAllocationLimitReached+65
 5: 00007FF603C9E0F8 v8::Function::Experimental_IsNopFunction+1192
 6: 00007FF603AEEC30 v8::StackTrace::GetFrameCount+426608
 7: 00007FF603AEBF15 v8::StackTrace::GetFrameCount+415061
 8: 00007FF603B01314 v8::StackTrace::GetFrameCount+502100
 9: 00007FF603B01BD8 v8::StackTrace::GetFrameCount+504344
10: 00007FF603B11D39 v8::StackTrace::GetFrameCount+570233
11: 00007FF6037DF5CB v8::CodeEvent::GetFunctionName+112299
12: 00007FF5A3D2667A
Please help me find the cause and how to resolve it.